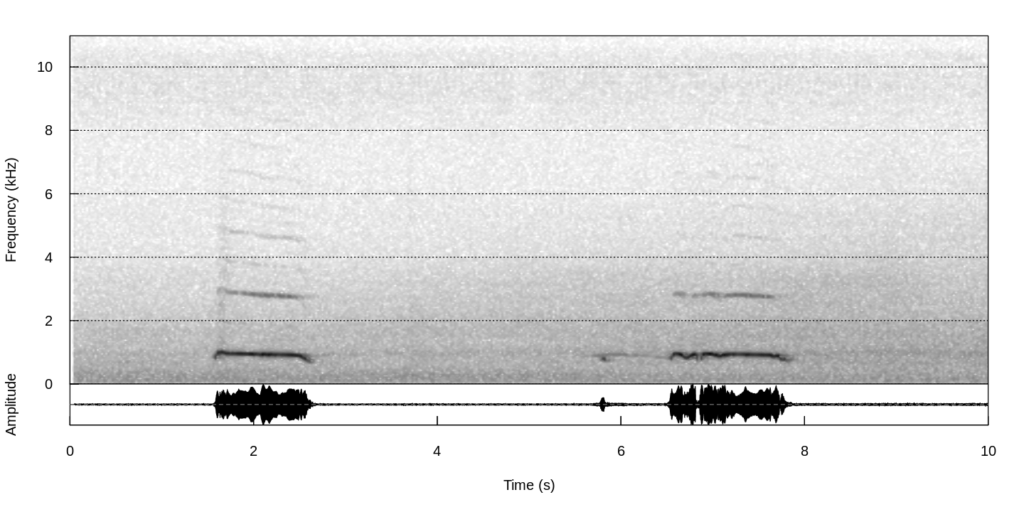
Spectrograms are a common visualization of sound data. Visualizing sound data can be useful when doing a presentation or for publication. Additionally, machine learning algorithms for classifying sound data generally use spectrograms as their starting point, instead of the sound data itself, as many advanced algorithnms for classifying images are readily available. The example uses the R packages warbleR (Araya-Salas & Smith-Vidaurre, 2017), seewave (Sueur, Aubin, Simonis, 2008) and tuneR (Ligges et al., 2018).
This example draws the spectrogram of the call of a tawny owl (Strix aluco).