Neue Publikation, beim Umweltbundesamt!
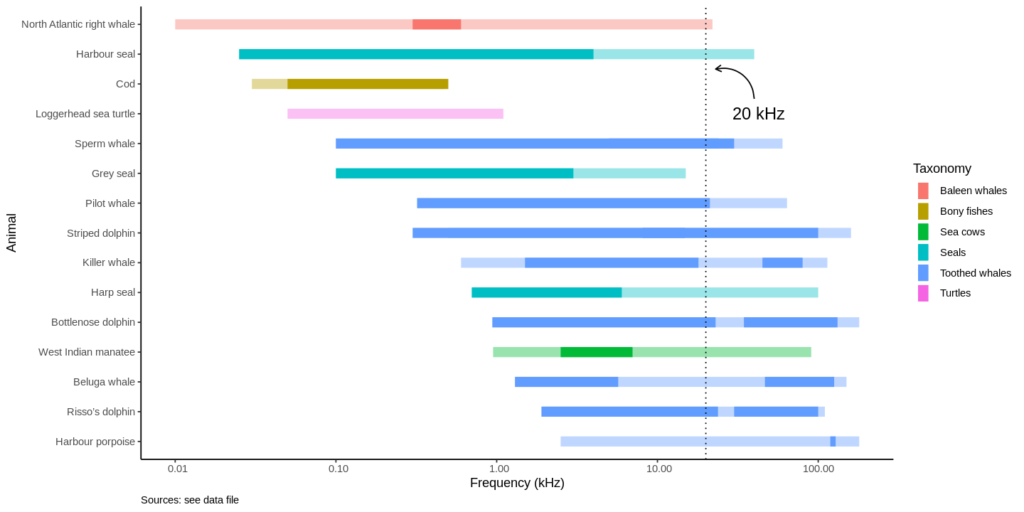
Das Projekt untersuchte das Hörvermögen von Humboldt-Pinguine. Darüber hinaus wurde eine Tieraudiogramm-Datenbank entwickelt, die den Vergleich zwischen den veröffentlichten Hörkurven verschiedener mariner Tiere erlaubt. Mit diesem Vorhaben wurde der Grundstein für zukünftige Studien über das Hörvermögen von tauchenden Vögeln gelegt hat und so zu einem größeren Verständnis beigetragen, inwiefern Meeresvögel von Unterwasserlärm betroffen sind.
https://www.umweltbundesamt.de/publikationen/hearing-in-penguins-hoerfaehigkeiten-von-pinguinen