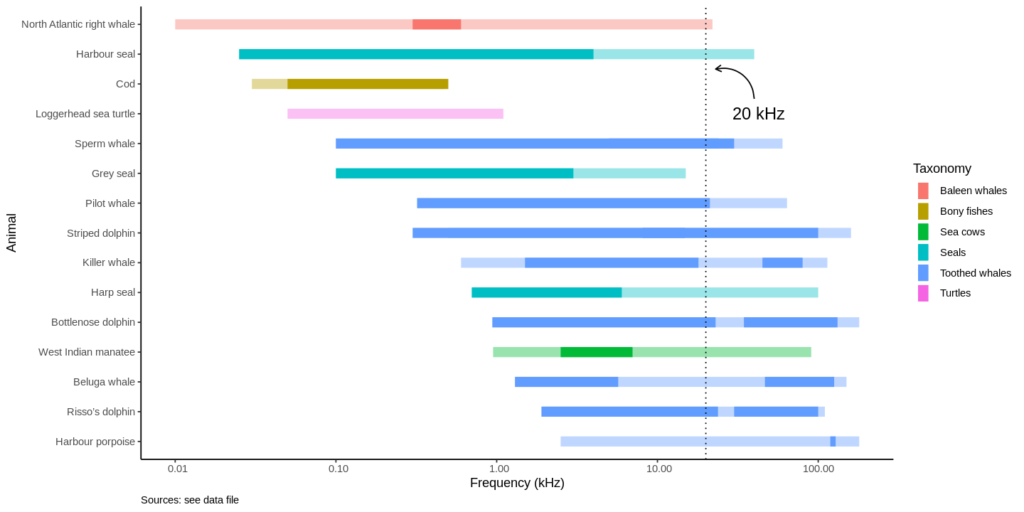
For a project on noise pollution in the oceans at the Natural History Museum in Berlin, I recently made this plot of the hearing and vocalization ranges of selected marine animals. Range plots are generally not-so-common plots. In this example, I plotted the hearing and vocalization range (frequency) for several species of whales, dolphins, seals, turtles and fishes.
Continue reading “Hearing and vocalization ranges of marine animals”Ecological data sets in R-core
If you are using R, then you are probably familiar with the mtcars data set, that is used in many R tutorials. The “car analogy” is so common in text books, that this so-called technique has its own Wikipedia page. For the rest of us, who don’t understand anything about motor cars, R-core comes with a wide selection of example data sets, some of which relate to ecology or biodiversity.
Continue reading “Ecological data sets in R-core”