Paleontological data can be obtained from specialized online databases, and can be processed using specialized libraries. Here, I will use the NOW (New and Old World) database of fossil mammals to plot the distribution of mammoths in Europe and use the R library deeptime (Gearty, 2023) to clean up the data.
library(dplyr)
library(ggplot2)
library(maps)
library(mapproj)
library(deeptime)
library(repr)
Using the web interface, download a list of all occurrences of the genus Mammuthus from the NOW database (The NOW Community, 2023). Data can be downloaded in tab-separated format and read into a pandas dataframe (replace the name-of-the-file).
# read the table (tab-separated)
mammuthus_df <- read.csv("Mammuthus/now_export_locsp_public_name-of-the-file.csv", sep="\t")
Use the R library dplyr to only keep rows with complete data for Genus, Species, Country, Latitude and Longitude, min age, max age and body mass. Note that min age and max age are derived from species.
mammuthus_clean <- mammuthus_df %>%
select(GENUS, SPECIES, COUNTRY, LAT, LONG, MAX_AGE, MIN_AGE, BODYMASS) %>%
mutate(SPECIES = na_if(SPECIES, "indet.")) %>% # drop rows without species
mutate(BODYMASS = na_if(BODYMASS, "\N")) %>% # drop rows without body mass
mutate_at("BODYMASS", as.numeric) %>%
filter(!is.na(GENUS) & !is.na(SPECIES) & !is.na(LAT) & !is.na(LONG) &!is.na(BODYMASS))
Add a column for epoch, based on max age. Epoch names are obtained from the list of epochs in the package deeptime.
getEpochName <- function(MAX_AGE) {
    return(filter(epochs, MAX_AGE < max_age)[1,]$name)
}
mammuthus_clean["epoch"] <- mammuthus_clean %>% select(MAX_AGE) %>% apply(1, getEpochName)
Plotting European mammuth species on a map
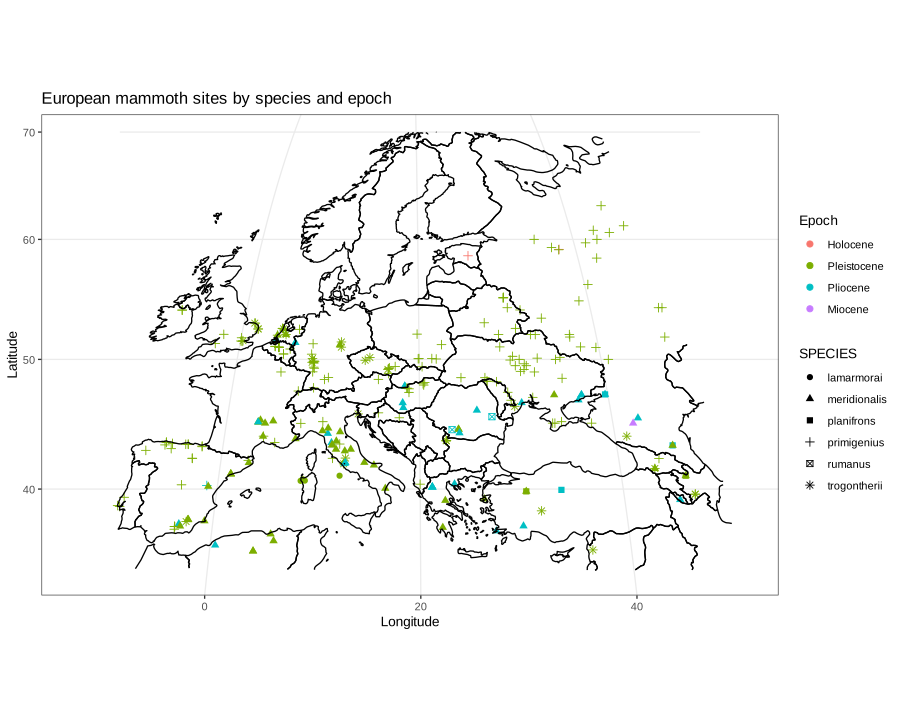
Use the maps package to plot the mammuth sites, by species and epoch, on a map of Europe.
# bounding box for Europe
LAT1 = 70 ; LAT2 = 34
LON1 = -12 ; LON2 = 50

# keep only European specimens
mammuthus_clean <- mammuthus_clean %>%
   filter(LONG > LON1 & LONG < LON2 & LAT > LAT2 & LAT < LAT1)
The map shows mammoth sites. Each datapoint shows the epochs (Holocene, Pleistocene, Pliocene and Miocene) as colors, and the mammoth species as the dot shape.
# load a line map
world_df <- map_data("world")
# plot mammuth sites on the map using geom_plot, plot map using geom_path
map <- ggplot(mammuthus_clean) +
   # plot mammuth sites as points
   geom_point(aes(LONG, LAT, shape=SPECIES, color=epoch), size=2) +
   # plot map
   geom_path(aes(x=long, y=lat, group=group), data=world_df) +
   # Europe bounding box, mind the order of LONs and LATs
   xlim(c(LON1, LON2)) + ylim(c(LAT2, LAT1)) +
   theme_bw() + labs(title="European mammoth sites by species and epoch", x="Longitude", y="Latitude") +
   # set legend titles
   scale_color_discrete("Epoch") + scale_size_discrete("Species")

# re-order the legend
mammuthus_clean$epoch <- factor(mammuthus_clean$epoch, levels = c("Holocene", "Pleistocene", "Pliocene", "Miocene"))
I used the Mollweide projection, which is an elliptical projection, i.e. meridians are ellipses. A list of supported projections is here.
# compute a map projection
proj <- coord_map(
    projection="mollweide"
)
# size
options(repr.plot.width=10, repr.plot.height=8)
# display
map + proj
The result is the map of European mammoth sites by species and epoch shown above.
Species succession in genus Mammuthus
The chosen time frame spans a million years, during which the genus Mammuthus evolved. European mammoths are generally classified in five species, the best known being the very large M. meridionalis (the southern mammoth) and the smaller M. primigenius (the woolly mammoth).
Plot the age of the specimen for all species in the genera Mammuthus in the data set.
# plot size
options(repr.plot.width=8, repr.plot.height=4)
# keep only last 2 Myr
mammuthus_clean %>% filter(MAX_AGE < 2) %>%
# boxplot, reorder by age
ggplot() +
   geom_boxplot(aes(x=reorder(SPECIES, (MIN_AGE-MAX_AGE)/2), y=(MIN_AGE-MAX_AGE)/2)) +
   xlab("Species") + ylab("Myr BP") +
   theme_bw()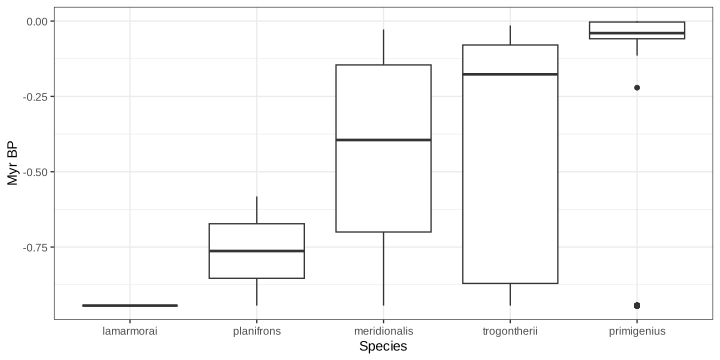
Discussion
Most sites throughout the map area date from the Pleistocene, additionally there are a number of Pliocene sites in southern Europe, and one Miocene site in the Caucasus.
During the Pleistocene, Northern Europe and Spain was populated by Mammuthus primigenius (the woolly mammoth), while Southern Europe had a population of Mammuthus meridionalis (the southern mammoth). Central Europe, the Balkans and the Caucasus was also populated by Mammuthus trogontherii (the steppe mammoth). Actually the steppe and southern mammoth species went extinct earlier than the woolly mammoth.
The map shows a site in Estonia dating from the Holocene (< 11kY), that’s very recent for a mammoth. Let’s examine these Holocene sites:
mammuthus_clean %>% filter(epoch=="Holocene") %>% arrange(MIN_AGE)| GENUS | SPECIES | COUNTRY | LAT | LONG | MAX_AGE | MIN_AGE | BODYMASS | epoch |
| Mammuthus | primigenius | Russia | 59.13 | 37.90 | 0.00984 | 0.00976 | 4357667 | Holocene |
| Mammuthus | primigenius | Estonia | 58.58 | 26.28 | 0.01100 | 0.01100 | 4357667 | Holocene |
It appears that the last mammoths mainly lived in Russia about 10.000 BP.
Jupyter notebook
The corresponding Jupyter Notebook for this post is here.
References
The NOW Community 2023. New and Old Worlds Database of Fossil Mammals (NOW). Licensed under CC BY 4.0. Retrieved [20. October 2023] from https://nowdatabase.org/now/database/.
DOI 10.5281/zenodo.4268068.
Gearty, W. (2023) Package “deeptime”, Plotting Tools for Anyone Working in Deep Time, https://cran.r-project.org/web/packages/deeptime/deeptime.pdf